The prosodic distance analysis
Introduction:
Prosodic variation may be studied in a dialectometrical perspective and may be even displayed in maps as suggested by Contini since 1991. In fact, language atlases are conceived as empirical databases allowing a detailed documentation of specific language features by the collection of a consistent number of locations. At a later time, data are treated and classified according to different methodologies in order ‘to abstract and visualise a basic pattern from the immense amount of data found in the language atlases’ (Nerbonne & Kretzschmar, 2013). The concept of intonation dialectometry took inspiration from the several works of Séguy and Goebl, who measured the lexical variability of specific dialectal areas using statistical methods. The idea of applying this methodology to the prosodic studies was later developed by Hermes (1998) and saw a first application in Romano (2001), for the evaluation of the intercorrelation in a sequence of repetitions uttered by the same speaker. Several works will follow this methodology (Rilliard & Lai 2008, Romano & Miotti 2008, Romano et al. 2011) until the first cartographic application of the prosodic distance (Moutinho et al., 2011).
Method:
As already mentioned, the aim of this work was collecting a significant amount of data in order to compare different prosodic patterns. In a second moment, the 8 varieties have been normalised through a script and correlated among them applying a correlation measure. This is based exclusively on the f0 but weighted according to the signal energy associated to the point where the measurements are caught hence attaching importance to the voiced elements of a sentence which are also considered as the most perceptively pertinent (Hermes, 1998). This measurement also ignores any idiosyncratic variations (such as register, main pitch) due to specific speaker qualities. An adaptation of the formula (Moutinho et al., 2011) readapted by D’Alessandro et al. (2011) from the works of Hermes (1998), is applied for the evaluation:

Figure 3.24. Formula taken by Moutinho et al. (2011).
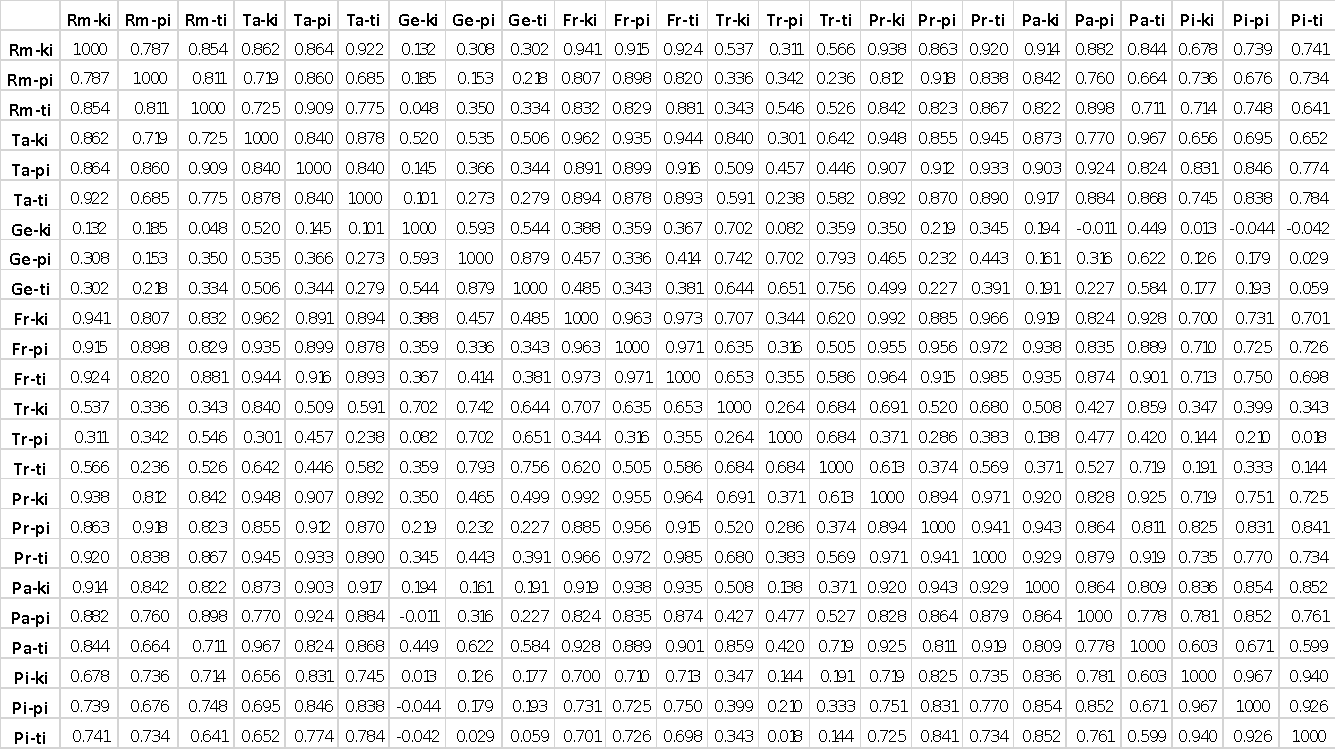
f1 and f2 represent the f0 values of the two intonation contours (expressed in semi-tons), while m1 and m2 the average values of these contours on the whole sentence. W is the weighting due to the signal energy, calculated as the average of the two energy values, measured at a given point for the two compared sentences (expressed in dB), while index i varies from 1 to the considered f0 points of the chosen sentence. According to the AMPER protocol, the f0 and energy values extracted are 3 points of f0 per vowel, weighted at the same average energy value. Starting from this correlation measurement, obtained by means of the specific Matlab™ scripts already mentioned, it is possible to generate a correlation matrix as the one shown in figure 3.25.

Figure 3.25. Correlation matrix for the interrogative B structures of the 8 varieties.
The graphical result offered by the intonation curves is therefore associated to these matrices allowing a deeper insight on the cross-correlation of selected sentences by highlighting the degree of correlation (from a minimum of 0 to a maximum of 1) among each realisation. For example, in figure 3.28, a high correlation between the Prato and Frosinone variety for the sentence pwki (0,991) is evident. In some cases, the correlation can also result negative (-0,044 between the structure pwki of Genoa and pwpi of Pisa).
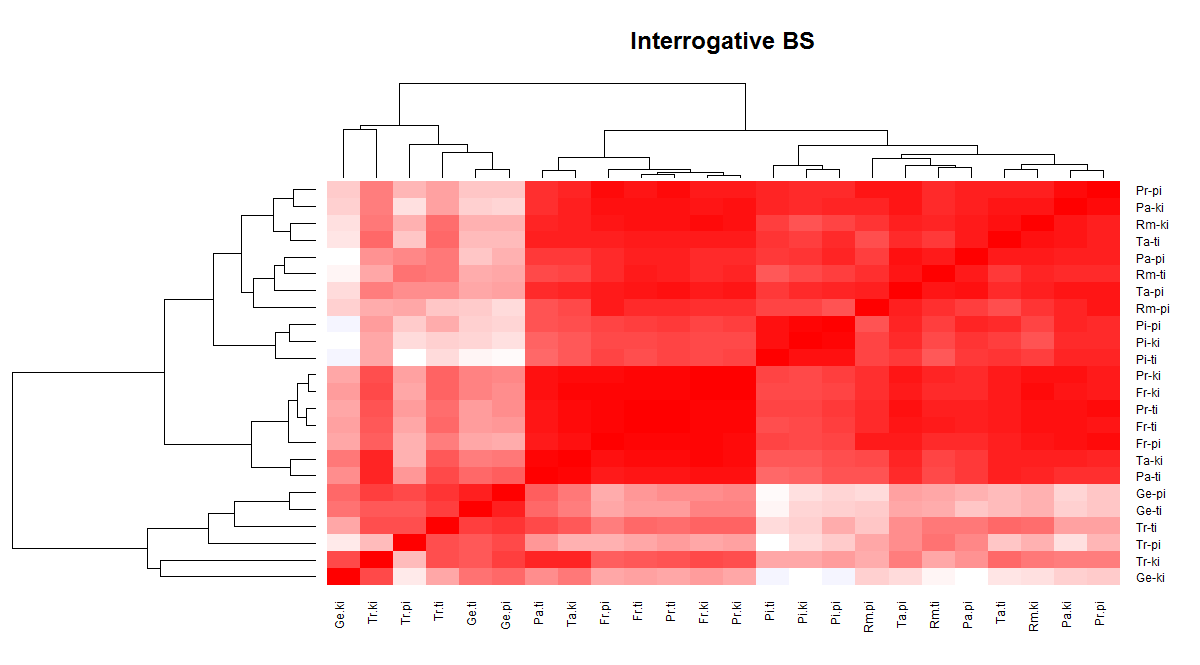
The values are therefore processed by a cluster analysis, specifically using several statistical outputs: the heatmap, for example, converts the varieties correlation in shades of red (max. correlation), blue (min. correlation) and white (low correlation) grouping the potential clusters by a dendrogram (figure 3.26).

Figure 3.26. Heatmap showing the correlation among the interrogative B structures of all the varieties.
The figure above shows for example a neat distinction between the two Gallo-Italian varieties (Trento and Genoa) and the others, highlighted in the heatmap by pale shades and the dendrogram. In the second group, a further distinction is clear: the first one concerns the varieties of Frosinone and Prato (respectively divided according to the morphosyntactic structure, oxytone or paroxytone), the other one assembling two different varieties (Taranto and Pollina). In the second group, there is a first division including the Pisan variety and two main subgroups: the proparoxytone structures of Rome, Taranto and Pollina and the oxytone structures of Rome and Pollina.